Too many SaaS founders look at a wall of numbers every month and still miss the few that matter. That is how businesses post decent sales, then get surprised by churn, cash pressure, or a fundraising gap three months later.
A proper monthly SaaS metrics pack fixes that. It is not a finance report for the sake of it. It is a decision tool that tells you, in plain terms, whether growth is real, whether customers are staying, and whether cash is holding up.
If the pack is clear, you spot issues early. If it is bloated, it gets ignored. Start with the numbers that change decisions.
Start with the few numbers that show whether the business is moving in the right direction
Your pack should open with the headline numbers that give a fast read on business health. Founders scan these first. Investors scan these first. Boards do the same.
This opening page is not the place for twenty charts. It is the place for the few metrics that explain the direction of travel. Revenue growth, customer retention, and expansion from the base you already have. If those three areas are weak, the rest of the pack becomes noise.
MRR and ARR: the clearest view of recurring growth
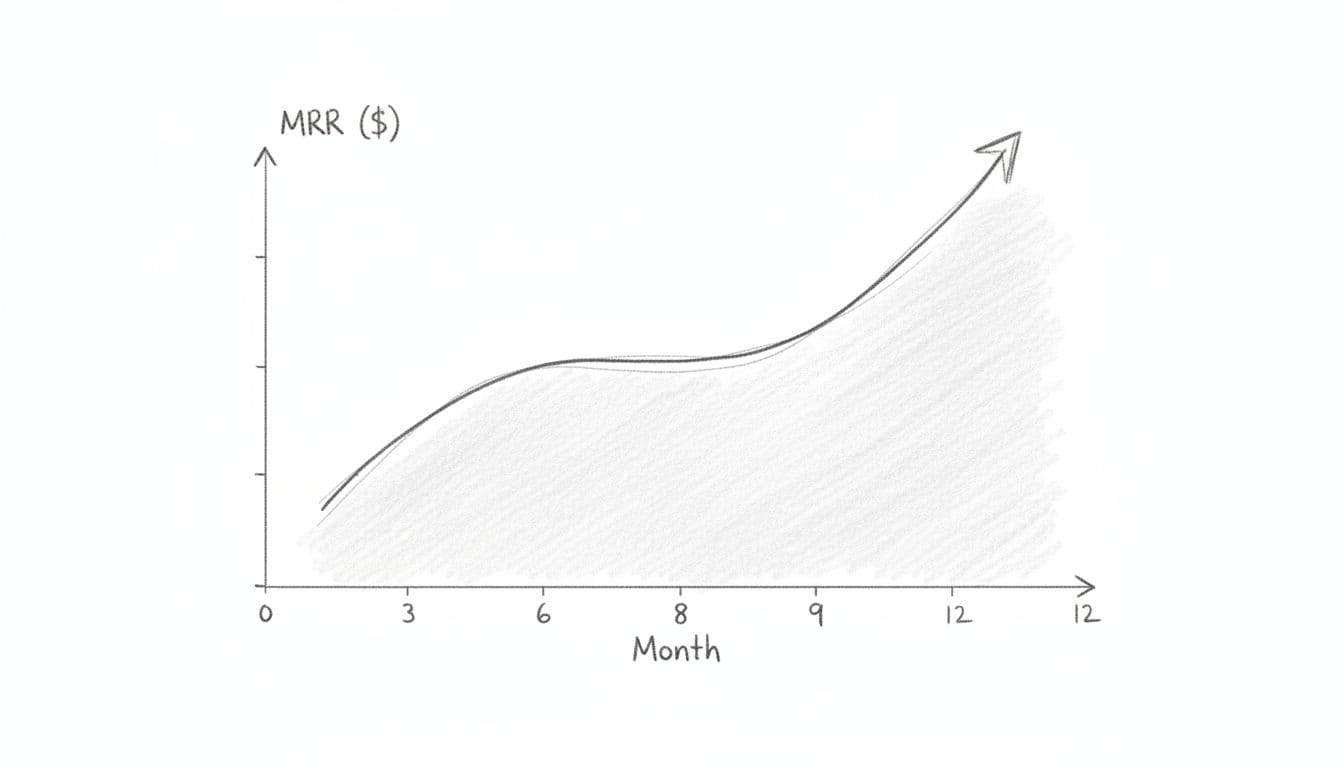
MRR and ARR are the backbone of the pack. Monthly Recurring Revenue tells you what contracted recurring revenue looks like now. Annual Recurring Revenue turns that into a bigger-picture figure and helps people compare scale across periods.
What matters is not one month in isolation. It is the trend. A spike from one large annual contract can flatter the picture. A twelve-month view shows whether revenue is compounding or stalling.
These are the headline figures most people read first because they cut through the story fast. Is recurring revenue moving up? Is the pace improving? Is growth broad-based or carried by a small number of deals?
Churn and retention: the warning lights you cannot ignore
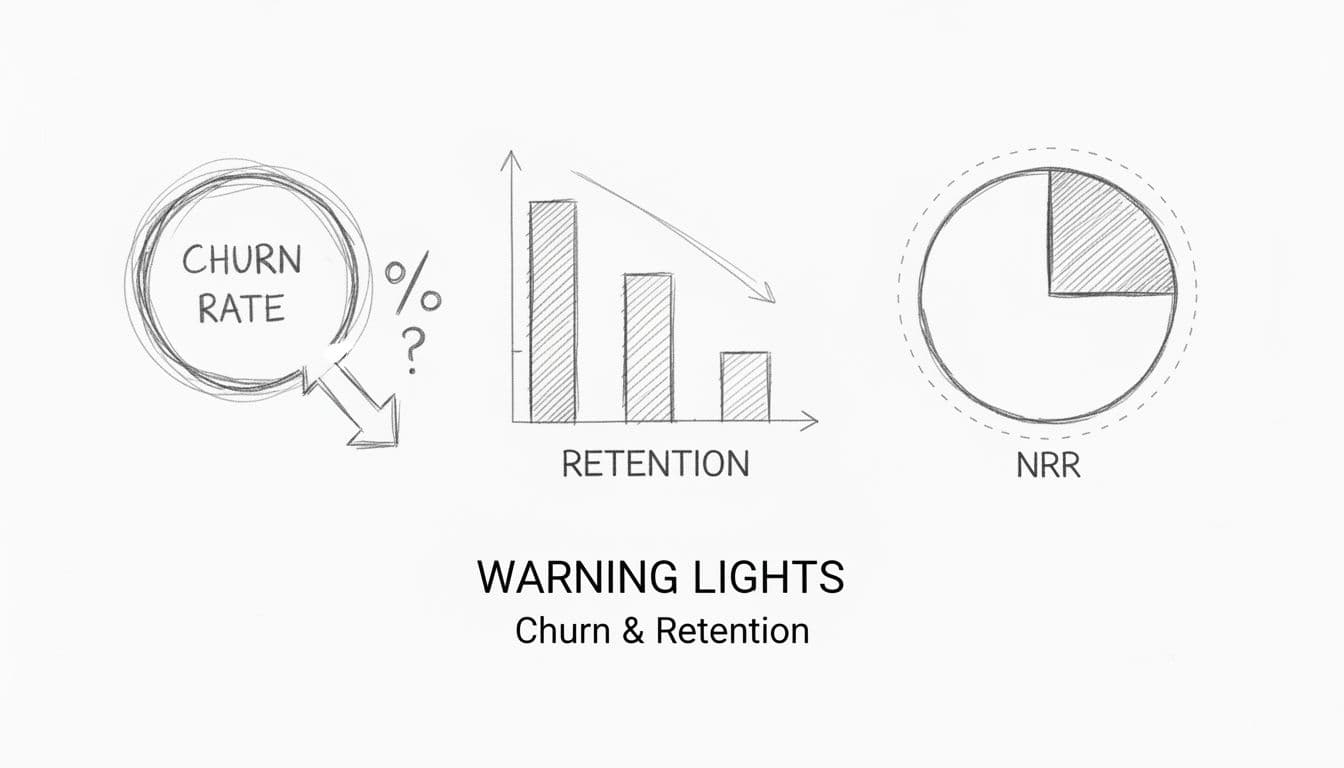
New bookings get attention. Churn takes money off the table. That is why retention belongs near the top of the pack, not buried halfway down.
Customer churn shows how many customers leave. Gross retention shows how much revenue you keep before expansions. If you are losing customers at the back door, new sales can mask the problem for a while. Then growth slows, sales pressure rises, and the business starts working harder for the same result.
Low churn gives confidence that customers get value and want to stay. In plain English, it is one of the strongest signs that product-market fit is becoming real.
NRR: the metric that shows if customers are expanding with you
Net Revenue Retention, or NRR, answers a simple question. Are existing customers worth more over time, even after downgrades and churn?
If NRR is above 100%, your customer base is expanding. That can come from upsells, cross-sells, seat growth, or price increases that hold. When new sales are lumpy, strong NRR often keeps the business moving.
This is why serious investors care about it so much. A good NRR number tells them customers stick, spend more, and get ongoing value. In 2026 benchmark reports, many Series A businesses sit around 100% to 105%, whilst stronger performers push past 120%. That gap matters. It often separates a business that is growing from one that is compounding.
Growth gets attention. Retention keeps the engine honest.
Add the metrics that tell you if growth is actually efficient
Recurring revenue is only half the story. The next question is whether growth is being bought at a sensible cost.
A SaaS business can grow and still damage itself if acquisition costs are too high, payback is too slow, or delivery costs eat through margin. This is where the pack moves from top-line progress to commercial quality.
CAC and LTV: the basic check on sales efficiency
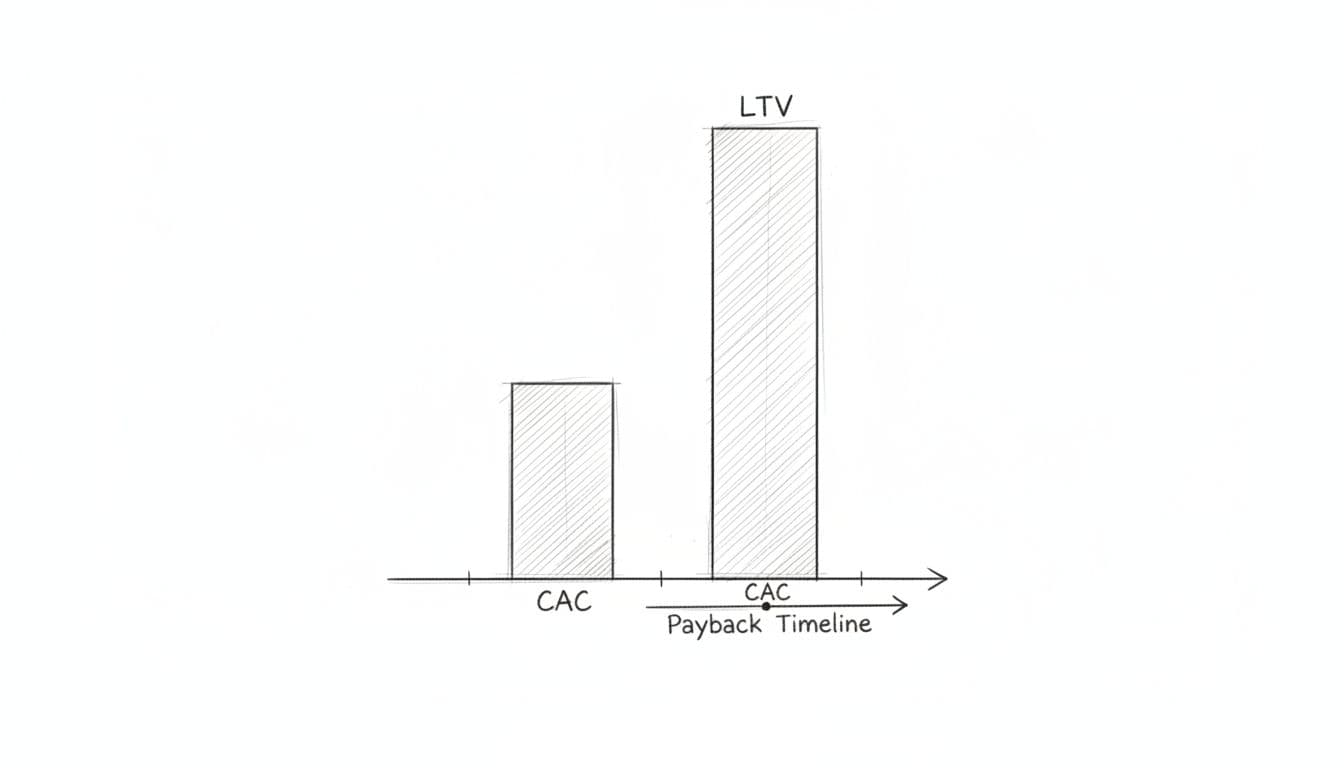
Customer Acquisition Cost tells you what it costs to win a customer. Lifetime Value estimates how much gross profit that customer is likely to generate over time. Put together, they tell you whether sales and marketing spend makes economic sense.
If CAC is rising faster than LTV, something is off. It might be channel mix, weak pricing, poor conversion, or churn shortening customer life. Whatever the cause, the pack should make it visible.
The LTV:CAC ratio is the simple check founders need. For more mature SaaS businesses, 3:1 is often treated as the minimum acceptable level. Around 4:1 is healthier. Much higher can mean you are under-investing in growth.
CAC payback period: how quickly new customers pay you back
CAC payback period shows how many months it takes to recover acquisition cost from gross profit. It is one of the cleanest measures of capital efficiency.
Why does it matter? Because slow payback creates cash pressure. If you spend today and only recover that spend far down the line, growth starts consuming working capital fast.
Published 2026 benchmark reports put many Series A SaaS companies in the 18 to 24 month range, with stronger businesses below 12 months. Shorter payback gives you options. Longer payback forces caution.
Gross margin: the number that shows what is left after delivery costs
Gross margin is what remains after direct delivery costs, such as hosting, support, implementation, and service-related tooling. It tells you how much room the business has to fund product, sales, hiring, and future scale.
A company with weak gross margins can still post revenue growth, but the model is harder to finance. Every pound of new revenue carries less contribution into the business.
This is worth watching closely in SaaS and AI businesses. Traditional SaaS often targets 70% plus gross margins. AI-native models can run lower because inference and infrastructure costs are heavier. The monthly pack should make that visible, not hide it inside the P&L.
Make cash and runway part of every monthly pack
Revenue on paper is not cash in the bank. Founders know this when payroll lands, VAT falls due, or a big customer pays late.
That is why cash tracking belongs in the monthly pack every time. Not when things look tight. Every time.
Burn rate and runway: the numbers that keep the business alive
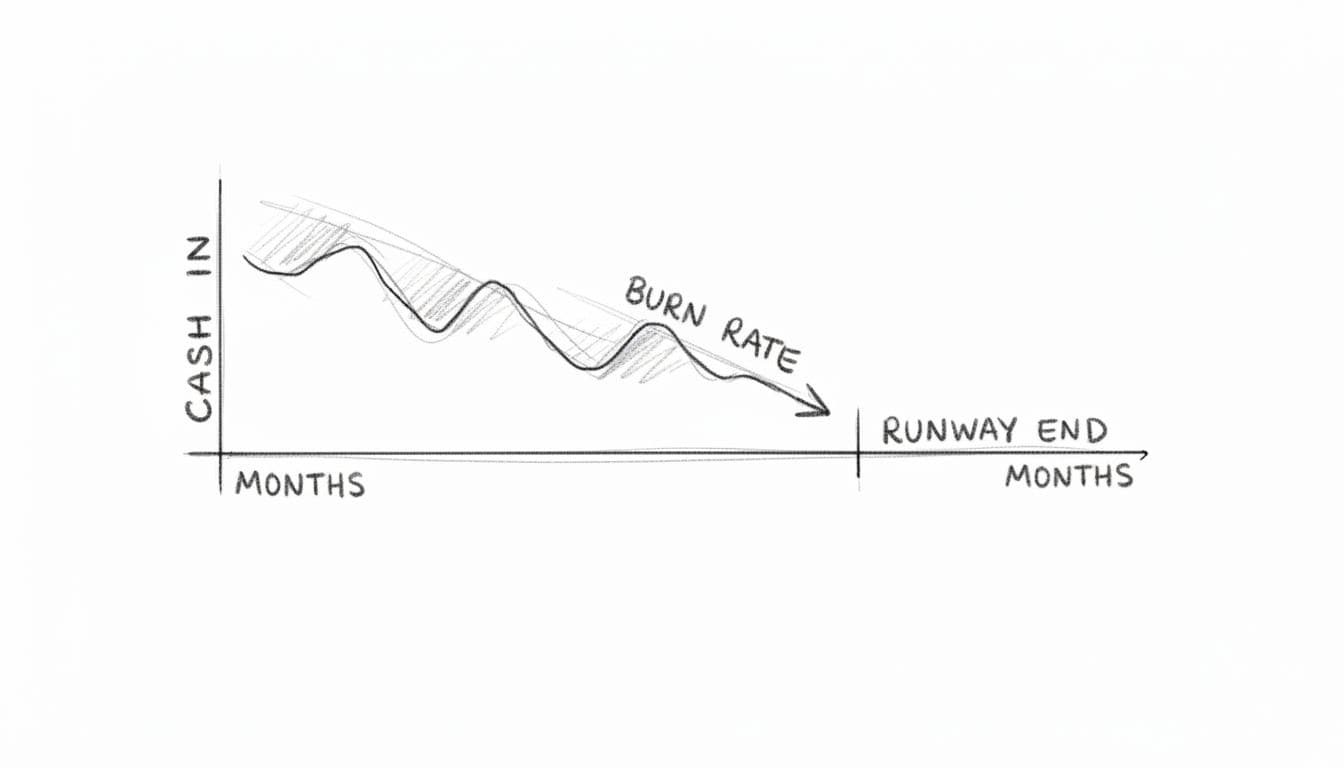
Burn rate shows how much cash the business is using each month. Runway tells you how long current cash will last at that pace. These numbers are not dramatic. They are operational. They tell you how much time you have to fix, raise, or adjust.
Founders need them monthly because problems rarely arrive in one jump. They build. Hiring moves faster than collections. Sales cycles slip. A raise takes longer than expected. Suddenly the timeline is shorter than anyone thought.
Cash collection and overdue invoices: where hidden pressure builds
A strong bookings month can still produce a weak cash month. If invoices are late, collections are loose, or payment terms are drifting, pressure builds fast.
Your pack should track cash collection, overdue invoices, and debtor days. This is basic control. It is also one of the fastest ways to improve cash without changing product or headcount.
For venture-backed companies, it supports planning. For bootstrapped companies, it can be the difference between comfort and stress. Either way, you want to see the issue before the bank balance makes the point for you.
Shape the pack around the stage your SaaS company is in
A pre-seed business does not need the same level of reporting as a Series B company. The pack should grow with the business.
If it gets too detailed too early, the team spends time feeding a document instead of using it. If it stays too thin as the company scales, risk hides in the gaps.
What early-stage founders should track first
At the early stage, clarity beats complexity. Track the few metrics with the highest signal: MRR, churn, active customers, gross margin, cash burn, and runway.
That is enough to answer the basic questions. Are customers buying? Are they staying? Is the model holding up? How long have we got?
What becomes more important as the company scales
As the business grows, the pack needs more depth. NRR becomes more important. CAC payback matters more. Cohort trends start telling a richer story than headline averages. Forecasts need to be board-ready, not founder-only.
This quick view keeps the pack proportionate to stage:
| Stage | Priority metrics | Why they matter most |
|---|---|---|
| Pre-seed to seed | MRR, churn, active customers, burn, runway | Fast read on traction and survival |
| Series A | NRR, CAC, payback, gross margin, forecast | Shows efficiency and funding readiness |
| Series B and beyond | Cohorts, segment margins, expansion, board pack commentary | Supports scale, planning, and governance |
The point is not to collect more data. The point is to keep the pack useful.
Turn the monthly pack into a tool for better decisions
A metrics pack has no value sitting in a folder. Its job is to support decisions, sharpen discussion, and keep management honest about what is changing.
That means every monthly pack should be reviewed with context. What moved? Why did it move? Does it change hiring, pricing, sales targets, or cash planning?
Use trends, not one-month snapshots, to spot real change
One month can be noisy. A delayed invoice, a single enterprise deal, or one customer downgrade can distort the picture.
Trend lines matter more. Month-on-month movement, rolling averages, and cohort behaviour show whether a shift is real. This is how founders avoid overreacting to noise and missing genuine changes in the business story.
Keep the pack board-ready and investor-friendly
Good reporting is clear, short, and factual. A board member or investor should be able to scan the pack and understand growth, retention, efficiency, and cash within minutes.
That does not mean bland. It means disciplined. Clean charts. Consistent definitions. Short commentary that explains movement and action. If you are raising, this discipline matters even more. Founders who know their numbers speak with more confidence because the reporting is already doing part of the work.
A proper board-ready pack is not theatre. It is evidence.
Conclusion
Founders do not need more dashboards, more tabs, or more finance jargon. They need the right numbers, in one place, every month.
The best pack covers growth, retention, efficiency, and cash. It shows trend, not noise. It helps you act before a problem gets expensive.
When the pack is built properly, you stop guessing. You start running the business with evidence.

Over 12 years across Big Four audit, investment banking and corporate advisory. Kishen works with UK SaaS and AI companies on financial strategy, fundraising and board-level CFO support. ICAEW regulated. Big Four trained. Based in London.